7385 Swabian bulls and 2 Viennese mermaids: Interpreting the Bernstein cartography of papers and watermarks
Vlad Atanasiu, 2009.07.28
This document presents various representations of the spatial distribution of paper and watermarks in the databases of project Bernstein and shows specific interpretations to which they are adapted.
1. Comparing watermark distributions
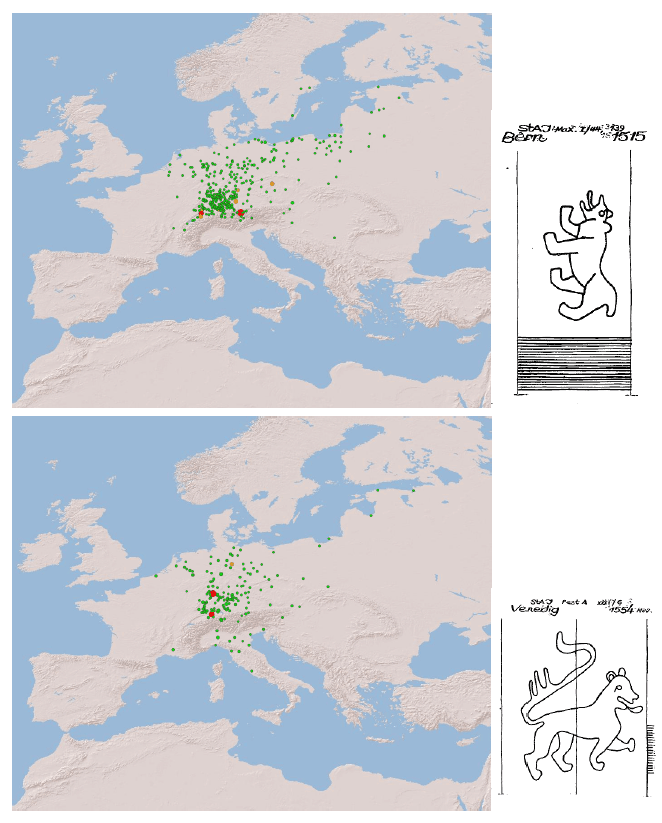
Data – Distribution of locations where paper documents with of watermark motifs "bear" (top) and "lion" (bottom) where used, as it appears from the placenames inscribed on the documents.
Discussion – These maps reveal potential cultural preferences: bears are much used symbols in Transalpine Europe and Alpine areas (note the orange dot on Bern, Switzerland), while in Italy there are lions (green dot on Venice). It is interesting to note that regional preferences for these two animals are well documented in heraldry (e.g. the coat of arms of the city of Bern). The new knowledge that paper studies brings is that these cultural preferences had an economic impact: papers with different watermarks had also different markets.
Visual charcteristics – The dynamic data mapping tool used here is useful when you want to show the precise location of mapped entities, since each location is represented by a symbol on the map.
2. Interpreting distributions
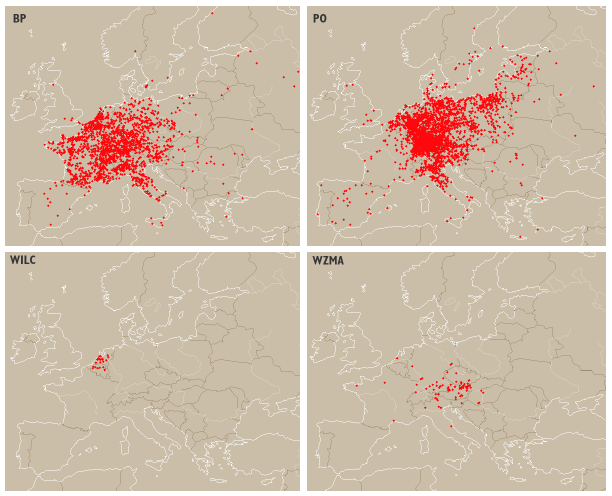
Data – Global watermark useplaces distribution in Bernstein databases: Briquet (top-left), Piccard Online (top-right), WILC (bottom-left) and WZMA (bottom-right).
Discussion – The difference of distributions between databases is clearly visible in these maps and Bernstein inherits these particularities. When interpreting any subsample – such as the bear and the lion watermarks on the previous page – its meaning should be sought only in regard to the reference distribution. The interpretations are valid only in those areas covered by Bernstein. Because Bernstein doesn't show any bears in Spain, it doesn't mean that there are none – it's just that Bernstein doesn't know about it yet. Similarly, if you would produce a map of bulls and mermaids, you'll see a big concentration of the first in Swabia and very few of the second in Vienna, while evidently many other places are blessed with an abundance of bulls and mermaids.
Visual charcteristics – The desktop mapping tool Wiz used for these maps can produce custom visualizations through programming and delivers a higher quality and more flexible output in form of vector data, which is interesting for further processing of the maps or for printing.
3. Understanding distributions
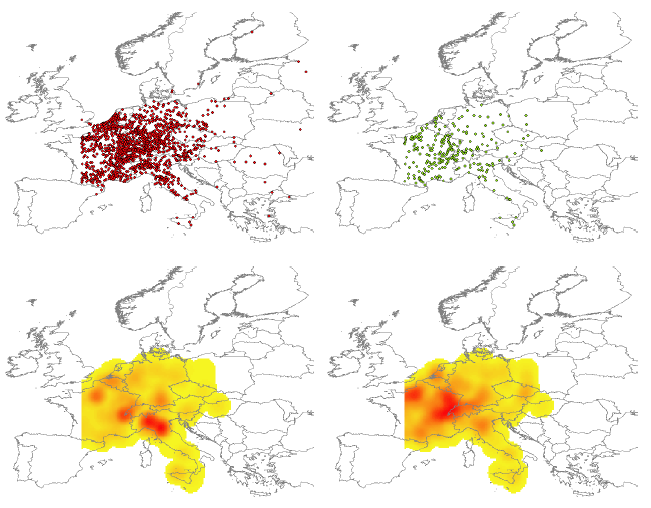
Data – Top-left: Watermarks useplaces in the Briquet database. Top-right: Libraries and archives where Charles-Moïse Briquet (1839-1918, depicted left) travelled to record watermarks. Bottom-left: Amount of time spent by Briquet in different areas based on the quantity of watermarks recorded in each location. Bottom-left: Most travelled areas by Briquet as given by the density of points in the repertories map.
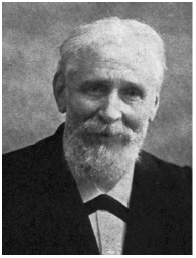 Discussion – These maps nicely underline the process by which the distribution in a database takes shape: papers are used in various places, those that survive the depredations of time are collected in libraries and archives, usually nearby their useplace, then a scholar decides which institutions s|he should visit and records some of them in an opus. The Bernstein databases are entirely depended on the various interests and motives that moved the respective cataloguers. Briquet for example, a wealthy industrialist and famous filigranologist from Genève, has mostly travelled the regions close to home – the Rhône and Upper-Rhenan valleys. But, judging by the time spend, he mostly enjoyed dwelling in Lombardy and Toscana. Thus comes that his fancy is still permeating hundred years later the kind of knowledge we have on watermarks. Read more about Briquet's life and work.
Visual charcteristics – The density maps shown here and produced by the static data mapping tool provide an intuitive way to judge the variation in entities density across regions.
 |